Application risk scoring in Polaris
Learn about the application risk scoring feature, key concepts, and how application risk scores are calculated.
Application risk scoring allows you to qualify the significance of applications in your portfolio with risk factors you define.
After you Enable application risk scoring, Polaris assigns a composite score (ranging between 0–100) to each application in your Portfolio. Higher risk scores indicate an application's vulnerabilities pose a larger threat to your organization. Each application's risk score is a function of:
- The quantity of DAST, SAST, and SCA issues detected in the application's projects (default branches only).
- The risk factor categories assigned to the application.
- The significance (or weight) of different risk factors in your organization.
Risk factors
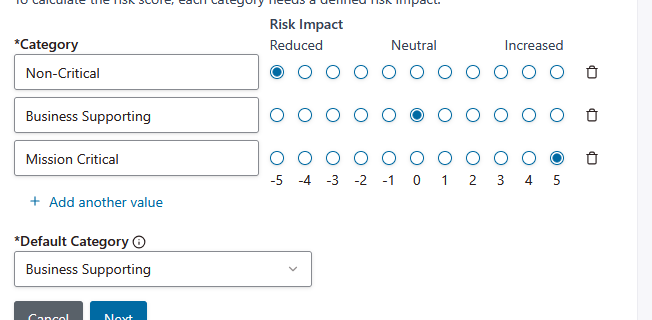
Each risk factor is a collection of user-defined categories (including one default category), and each category is assigned an impact value. In the following screenshot, you can see the categories, impact values, and default category assigned to the default risk factor, Business Criticality (which is created automatically when you enable application risk scoring).
Categories
Categories are user-defined values that correspond with characteristics or attributes of applications, and are used to quickly classify the applications in your portfolio.
Impact values
An impact value is mapped to each category. Impact values range between -5 and 5, where:
- A negative impact value will lower an application's risk score.
- An impact value of 0 (a neutral impact value) won't change an application's risk score.
- A positive impact value will raise an application's risk score.
Risk factor weights
A weight is assigned to each risk factor to control the significance of different risk factors in your organization. This allows you to make certain risk factors more or less effective on application risk scores.
Base issue risk scores
While only neutral categories (risk factor categories with an impact value of 0) are assigned to an application, its risk score is only derived from the issues captured in its projects, and calculated using base issue risk scores. The base issue risk scores of DAST and SAST issues correspond with severity.
| Issue severity | Base issue risk score |
|---|---|
| Critical | 95 |
| High | 80 |
| Medium | 50 |
| Low | 20 |
| Info | 0 |
SCA base issue risk scores are calculated by multiplying the issue's Vulnerability: Overall Score (found on the Issue Details tab) by 10.
Example calculation logic
Application risk scores are calculated in two steps:
- Polaris calculates a risk factor multiplier based on the categories assigned to the application.
- Polaris applies the multiplier to the base issue scores to determine the final application risk score.
Each step is described in more detail below. The following example risk factors will be used to demonstrate the calculation logic.
| Risk factor (risk factor weight) | Category | Impact |
|---|---|---|
| Asset Criticality (80%) | Non-critical | -5 |
| Business Supporting | 0 | |
| Mission Critical | 5 | |
| Accessibility (20%) | Isolated Network | -5 |
| Local only | 0 | |
| Internal connected network | 3 | |
| Internet-facing | 5 |
The following example vulnerabilities will be used to demonstrate the calculation logic:
| Application | Project | Issue | Base issue score |
|---|---|---|---|
| Example application | Example SAST & SCA project | Critical severity SCA issue | 9.8 (98) |
| Medium severity SCA issue | 5.5 (55) | ||
| Critical severity SAST issue | 95 | ||
| Medium severity SAST issue | 50 | ||
| Example DAST project | High severity DAST issue | 80 | |
| Informational severity DAST issue | 0 |
Part 1: Calculate the application's risk factor multiplier
Polaris uses the categories (and impact factors) assigned to the application to calculate the application's risk factor multiplier. In this example, three scenarios are considered to demonstrate how different categories affect the application's risk score.
The risk factor multiplier is calculated using the following formula: ({weighted average impact value} ÷ 10) + 1.
| Scenario | Risk factor | Risk factor weight | Category | Category impact | Weighted impact value |
|---|---|---|---|---|---|
| 1 | Asset Criticality | 80% | Business Supporting | 0 | 0 × 0.8 = 0 |
| Accessibility | 20% | Local only | 0 | 0 × 0.2 = 0 | |
| 2 | Asset Criticality | 80% | Mission Critical | 5 | 5 × 0.8 = 4 |
| Accessibility | 20% | Internet-facing | 5 | 5 × 0.2 = 1 | |
| 3 | Asset Criticality | 80% | Non-critical | -5 | -5 × 0.8 = -4 |
| Accessibility | 20% | Internal connected network | 3 | 3 × 0.2 = 0.6 |
The weighted average impact value is calculated by dividing the sum of weighted impact values by the sum of weights:
- Scenario 1 weighted average impact value: 0 ÷ 1 = 0
- Scenario 2 weighted average impact value: 5 ÷ 1 = 5
- Scenario 3 weighted average impact value: -3.4 ÷ 1 = -3.4
The weighted average impact value is then used to calculate the application's risk factor multiplier.
- Scenario 1 application risk factor multiplier: (0 ÷ 10) + 1 = 1
- Scenario 2 application risk factor multiplier: (5 ÷ 10) + 1 = 1.5
- Scenario 3 application risk factor multiplier: (-3.4 ÷ 10) + 1 = 0.66
Part 2: Calculate the application's risk score
To calculate the application's risk score, the application's risk factor multiplier is applied to base issue risk scores (for all DAST, SAST, and SCA issues captured in default branches in all of the application's projects). Then, the adjusted issue risk scores are used to calculate the application's risk score — a weighted average calculated using the adjusted issue risk scores and their weights. Issues with higher adjusted risk scores are more significant. The weights assigned to different issue risk scores are listed below:
| Issue risk score | Weight |
|---|---|
| 95 or higher | 50% |
| 80–94 | 30% |
| 50–79 | 15% |
| 20–49 | 5% |
| 0–19 | 0% |
Applying these weights to the issues in this example, the application's issue risk score is calculated:
| Issue | Adjusted base issue score | Weight | Weighted scores |
|---|---|---|---|
| Critical severity SCA issue | 98 × 1 = 98 | 50% | 98 × 0.5 = 49 |
| Medium severity SCA issue | 55 × 1 = 55 | 15% | 55 × 0.15 = 8.25 |
| Critical severity SAST issue | 95 × 1 = 95 | 50% | 95 × 0.5 = 47.5 |
| Medium severity SAST issue | 50 × 1 = 50 | 15% | 50 × 0.15 = 7.5 |
| High severity DAST issue | 80 × 1 = 80 | 30% | 80 × 0.3 = 24 |
| Informational severity issue | 0 × 1 = 0 | 0% | 0 × 0 = 0 |
The application's risk score is calculated by dividing the sum of weighted issue scores (136.25) by the sum of weights (1.6): 136.25 ÷ 1.6 = 85.15. In scenario 1, rounded to the nearest whole, the application's issue risk score is 85.
| Issue | Adjusted base issue score | Weight | Weighted scores |
|---|---|---|---|
| Critical severity SCA issue | 98 × 1.5 = 147 (reduced to 100) | 50% | 100 × 0.5 = 50 |
| Medium severity SCA issue | 55 × 1.5 = 82.5 | 15% → 30% | 82.5 × 0.3 = 24.75 |
| Critical severity SAST issue | 95 × 1.5 = 142.5 (reduced to 100) | 50% | 100 × 0.5 = 50 |
| Medium severity SAST issue | 50 × 1.5 = 75 | 15% | 75 × 0.15 = 11.25 |
| High severity DAST issue | 80 × 1.5 = 120 (reduced to 100) | 30 → 50% | 100 × 0.5 = 50 |
| Informational severity issue | 0 × 1.5 = 0 | 0% | 0 × 0 = 0 |
The application's adjusted risk score is calculated by dividing the sum of weighted issue scores (186) by the sum of weights (1.95): 186 ÷ 1.95 = 95.38. In scenario 2, rounded to the nearest whole, the application's issue risk score is 95.
| Issue | Adjusted base issue score | Weight | Weighted scores |
|---|---|---|---|
| Critical severity SCA issue | 98 × 0.66 = 64.68 | 50% → 15% | 64.68 × 0.15 = 9.70 |
| Medium severity SCA issue | 55 × 0.66 = 36.30 | 15% → 5% | 36.30 × 0.05 = 1.81 |
| Critical severity SAST issue | 95 × 0.66 = 62.70 | 50% → 15% | 62.70 × 0.15 = 9.40 |
| Medium severity SAST issue | 50 × 0.66 = 33 | 15% → 5% | 33 × 0.05 = 1.65 |
| High severity DAST issue | 80 × 0.66 = 52.8 | 30% → 15% | 52.8 × 0.15 = 7.92 |
| Informational severity issue | 0 × 0.66 = 0 | 0% | 0 × 0 = 0 |
The application's adjusted risk score is calculated by dividing the sum of weighted issue scores (30.48) by the sum of weights (0.55): 30.48 ÷ 0.55 = 55.41. In scenario 3, rounded to the nearest whole, the application's issue risk score is 55.