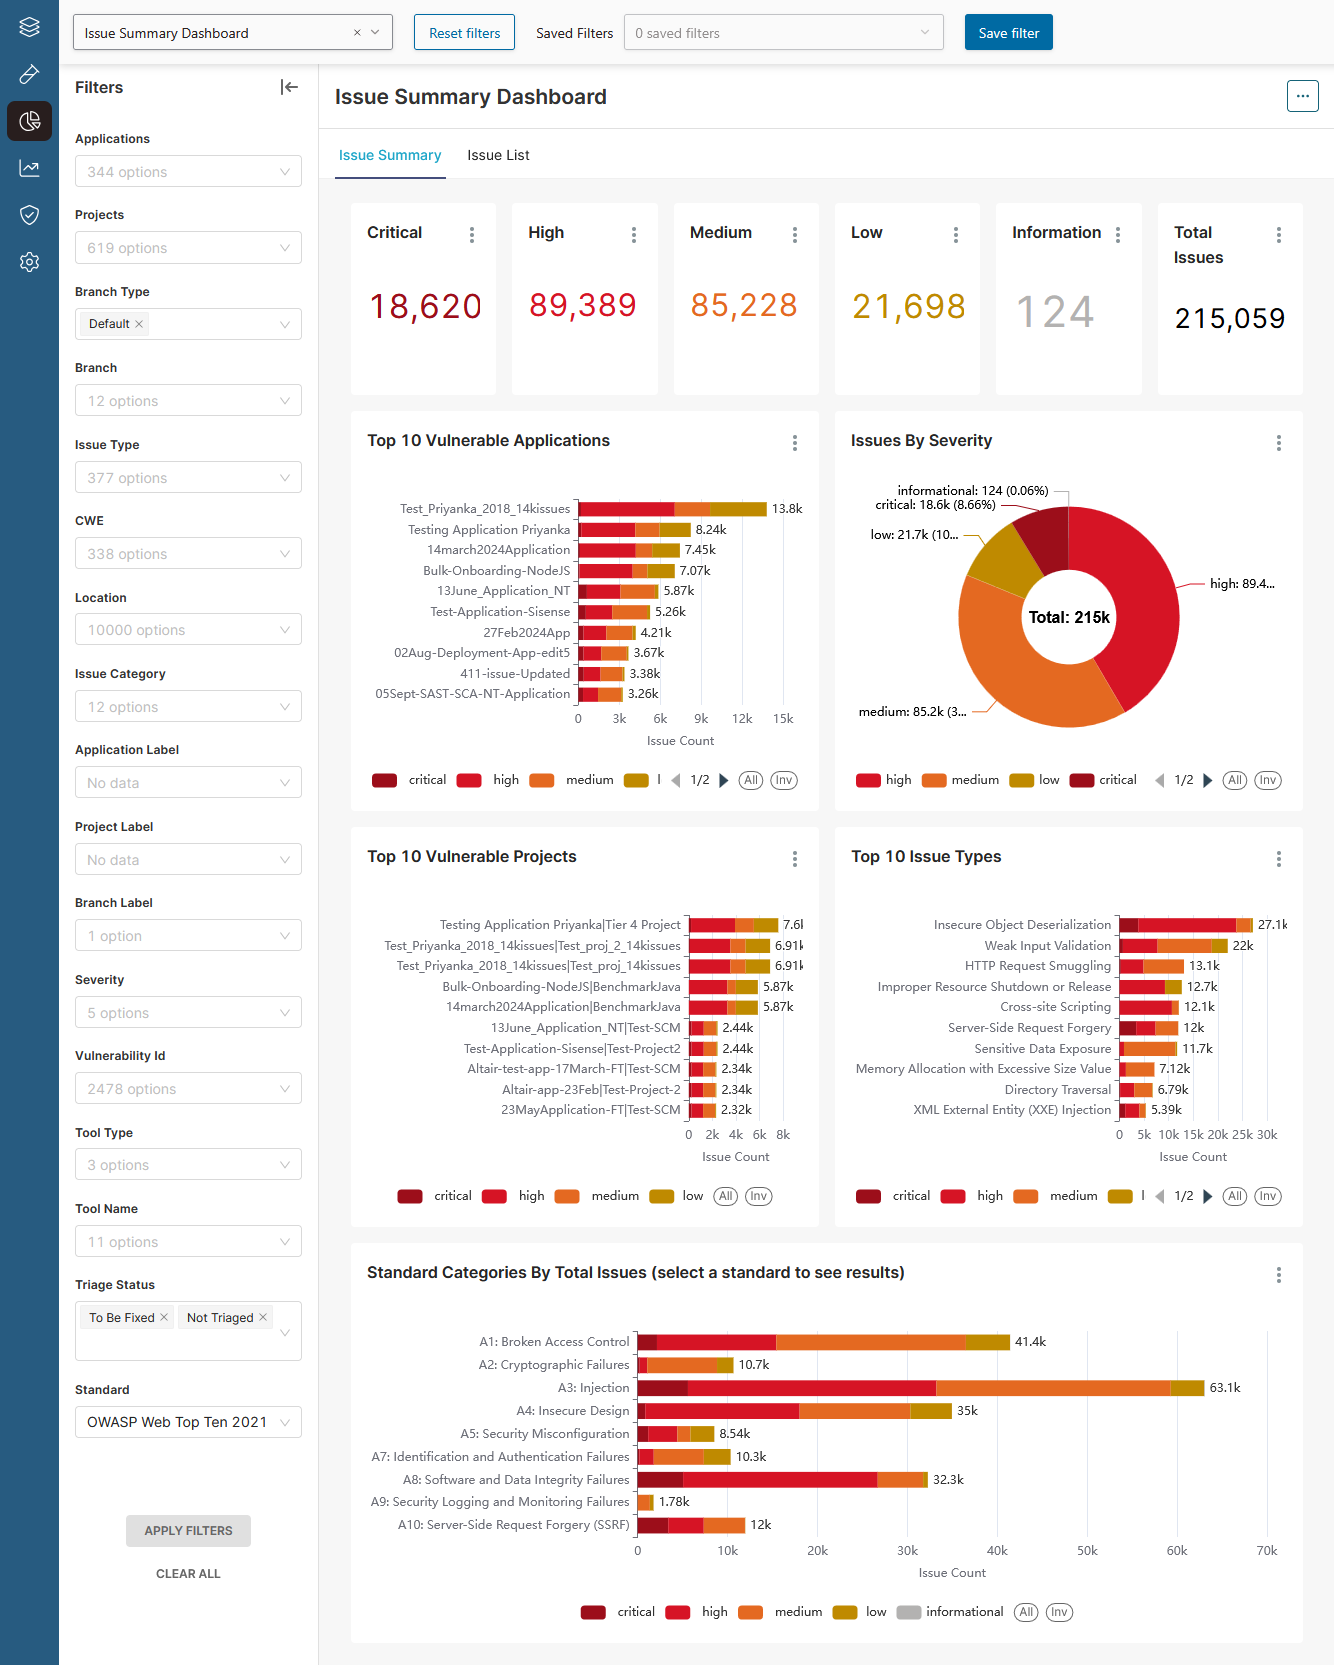
The Dashboards page
Use the Dashboards page to analyze and visualize SAST, SCA, and DAST test and issue data from your applications and projects.
Issues you import from third-party tools appear in dashboards, but the components and licenses associated with issues you import do not.
 |
|
| The Dashboards page | |
| Dashboards dropdown menu (top left) | Select a dashboard to open it. Polaris includes the following dashboards:
|
| Filter controls (top center) |
|
| Filters panel (left) | After you change options in the Filters panel, select APPLY FILTERS to adjust the scope of the dashboard. Available filters vary from dashboard to dashboard.
Select CLEAR ALL to clear all filters.
Note: To restore a dashboard's default filters, select Reset Filters instead.
|
Options button
 |
Select the options button to:
|
| Dashboard | A collection of interactive widgets, charts, and tables you can use to analyze information about your applications, projects, and Polaris usage. You can:
|
Note: See Work with dashboards for more information.