| + New Test |
Run a test. See How to test from the web UI. |
| Date Range |
A filter to find tests run between two dates. |
| Applications/Projects/Branches |
A filter to find tests run against specific applications, projects, or branches. |
| Test Types |
A filter to find:
- All Test Types (default)
-
DAST (All)
- External Analysis
- SAST
-
SCA
-
Package Manager or
- Signature Analysis
|
| Mode |
Filter tests by how they started. |
| Status |
A filter to find tests with specific statuses. |
| Clear Filters |
Clear filter selections. |
| Refresh |
Update the page. |
| Table fields |
- Test Date: The date and time when the test started.
- Test ID: An ID that uniquely identifies the test.
- Test Mode: How the test started (CI/CD, DAST, IDE, SCM, Source Upload, or Third Party Result Upload).
Note: By default, tests you run using Code Sight (from your IDE) are hidden.
- Application name: The application that was tested. Select an application to open the Application page.
- Project: The project that was tested. Select a project to open the Project page.
- Branch/Profile: The branch (for SAST & SCA projects) or profile (for DAST projects) that was tested.
- Select a branch to open the branch on the Project page.
- Select a profile to view issues in the DAST project on the Project page.
- Test Type: The type of test performed
(DAST, External
Analysis, SAST, or
SCA).
Tip: Hover over
name of the test in the Test Type column to see the
type (for example, SCA in the
Test Type column to find out if
analysis was Package Manager or
Signature Analysis).
- Test Status: Shows percentage done, progress bar, and status. Test statuses include:
- New: The test was requested, but has not started.
- Paused: Polaris couldn't validate the files being analyzed, or detected malicious files in the files being analyzed.
Tip: Hover over the error  icon to view more information.
- Queuing: The test is waiting in the queue to be processed.
Note: For a specific project and test type, only one test can be active at a time, with one further test waiting in the queue (assigned the Queuing status). If additional tests are requested beyond the active and queued tests, the first (most recently requested) test will be queued, and the status of older requested tests will change to Not Run and will not be queued or executed. This also applies to SAST or SCA tests run on the same branch. For more information, see Handling of queued tests.
- Scanning: Source code is being analyzed for a SAST or SCA test. A web application or API is being analyzed for a DAST test.
- In Progress: The test is running.
Note: After running a SAST test on a project's default branch for the first time, issues captured in the test may be sent to Black Duck Assessors for review and triage. While Assessors triage issues captured in a test, its status will be In Progress. Triage by Black Duck Assessors is only available with application-based subscriptions.
- Pending Review: An error or anomaly occurred during test execution that requires manual troubleshooting by Black Duck personnel.
- Scanning & Publishing: The results of the test are being published in Polaris.
- Completed: The test is finished and the results are available. If another test is queued, it can start.
Tip: Select the See Results  icon to view a completed test's results.
- Cancelled: A user in your organization cancelled the test. No results are available.
- Failed: An error occurred and the test could not be completed. No results are available.
Tip: Hover over the error icon to view more information.
- Waiting for Capture: The test is waiting for code capture to complete.
- Not Run: The test was requested, but was not run. No results are available.
Note: Only one test may be active per project and per test type at a time; one additional test (for the same project/test type) can be queued. If additional tests are requested beyond the active and queued tests, the latest (last requested) test will be queued, and the status of older requested tests will change to Not Run.
- Waiting for SCM Artifact: Polaris is retrieving source code (test artifacts) from your source code management system.
- Dialog icon: Select a comment icon
 to view comments from Black Duck assessors. to view comments from Black Duck assessors.Note: Assessor triage is only available on a SAST & SCA project's default branch.
- Test Time: Shows how long test took to complete.
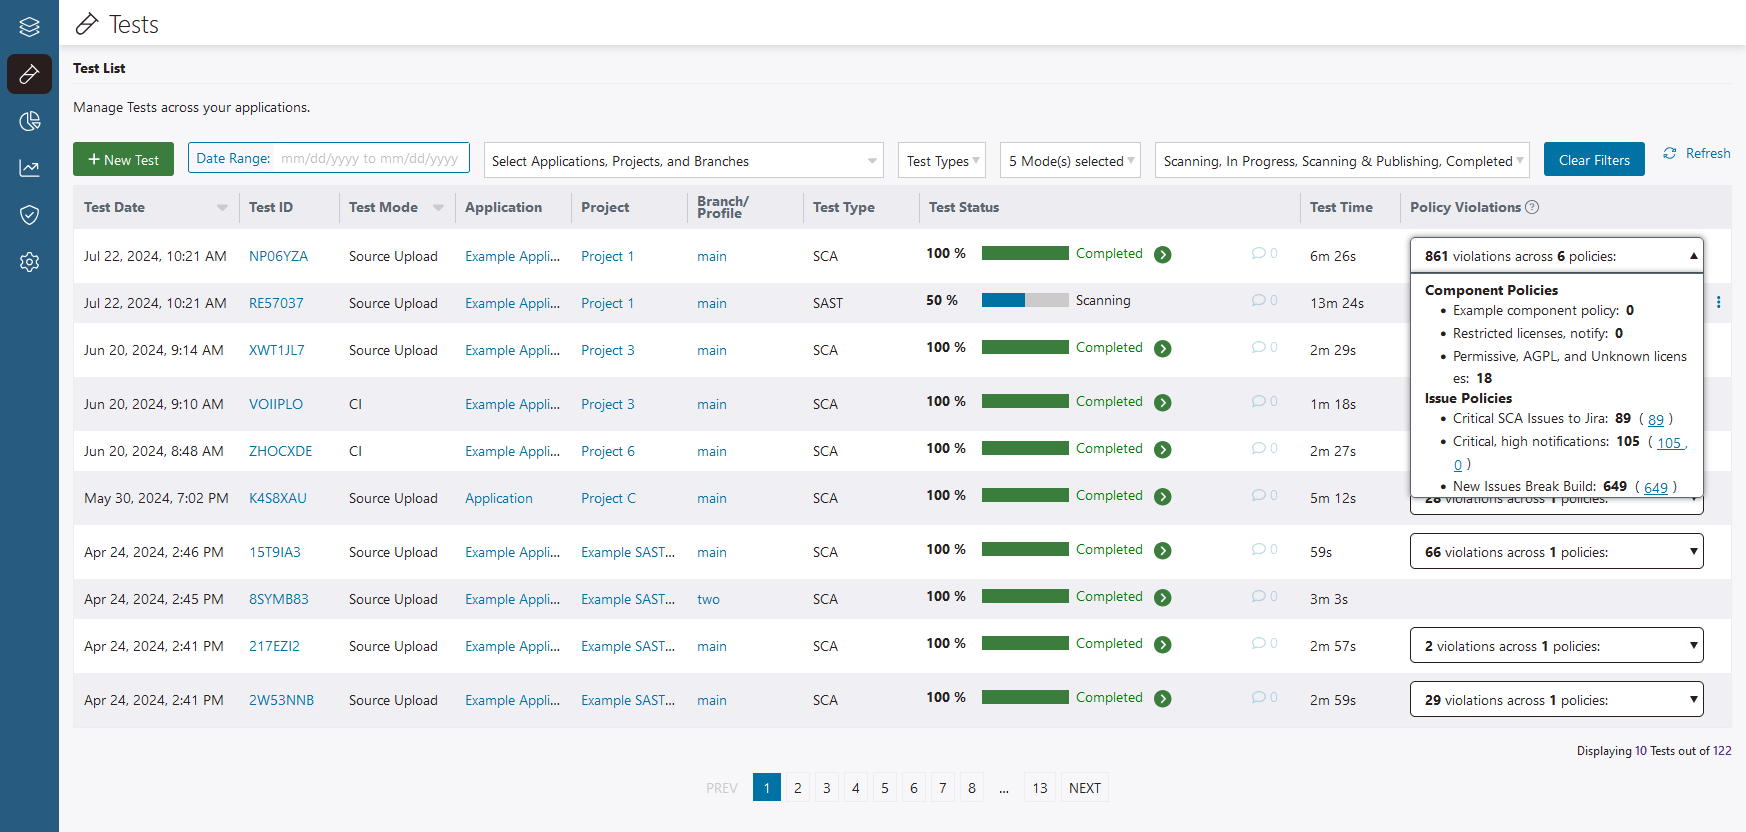
- Policy Violations: Shows the quantity of policy violations detected in the test, and the quantity of issue and component policies assigned to the project (or branch) when the test started. Select the info
 icon to see the names of the issue and component policies, along with links to view issues that violate different rules. icon to see the names of the issue and component policies, along with links to view issues that violate different rules. Note: Policy information only appears next to completed tests if issue/component policies were assigned to the branch (for SAST & SCA projects) or DAST project when the test started. Component policies only appear for SCA tests. See Monitor policy on the Tests page for more information.
When you create non-default branches, policies are disabled by default. You can enable policies on non-default branches when you Add a branch to a project or Edit a branch (manually created).
|