Work with dashboards
Use the Dashboards page to analyze and visualize SAST, SCA, and DAST test and issue data from your applications and projects.
Overview
The Dashboards page is available for all Polaris users, along with all the dashboards on it; however, users can only view data from the applications they have access to. Dismissed issues and excluded components (via issue and component triage) are not included in dashboards. Issues you import from third-party tools appear in dashboards, but the components and licenses associated with issues you import do not.
Switch between dashboards using the dropdown menu near the top of the page.
Interact with charts
All of the charts on the Dashboards page are interactive. You can:
- Hover over chart segments to see additional information.
- Select chart segments to quickly apply filters.
- Select an item in a chart's legend to hide/show data.
Filters
Use the options in the Filters panel and select APPLY FILTERS (near the bottom of the Filters panel) to adjust the scope of the dashboard. Available filters vary from dashboard to dashboard.
Select CLEAR ALL to clear all filters. To reset a dashboard's default filters, select Reset Filters (near the dashboards dropdown menu).
Refresh rate
It can take up to 60 minutes for:
- Issue data from a test to affect dashboards.
- Issue and component triage actions to affect dashboards.
Note: Dismissed issues and excluded components (via issue and component triage) are not included in dashboards. Issue and component triage actions only affect dashboards after changes are approved.
- Components you add, edit, or delete to affect dashboards.
- Changes made to application, project, and branch settings (including application, project, and branch labels) to affect dashboards.
- Changes made to file and folder exclusion rules to affect dashboards.
Dashboard reference
The table below includes short descriptions of the dashboards included with Polaris:
| Dashboard name | Summary |
|---|---|
| Executive Overview Dashboard | Provides an overview of application security and policy compliance in your organization. Includes charts that show open, introduced, and absent issues in your portfolio over time. While the default (out-of-the-box) filters are active, the dashboard includes results from the past year. |
| Issue Summary Dashboard | Visualize your organization's security profile across applications and projects. While the default (out-of-the-box) filters are active, dismissed issues are ignored. Open the Issue List tab (near the top of the dashboard) to view issue data in a sortable table. Columns include Application, Project, Issue Type, Severity, Test Type, CWE ID, Location, and Link (a direct link to each issue's details in Polaris).
Tip: Apply a Standard filter to populate the Standard Categories By Total Issues
chart.
|
| Onboarding Dashboard | View the quantity of applications and projects created in a time period, and how many of the applications and projects were tested. Includes trend charts for applications and projects created, and a table with the total number of tests run per project. |
| Polaris Risk Dashboard | View the risk scores of applications in your portfolio, the average risk score of applications in your portfolio, and 10 applications with the highest risk scores in your organization.
Note: Risk scoring data is only available while the risk scoring feature is enabled. See Application risk scoring in Polaris for more information.
|
| Policy Overview Dashboard | View the quantity of issues in your portfolio that violate your organization's policies. Includes charts that show applications and projects with the most policy violations, and widgets that show the quantity of applications and projects using your organization's default policies.
Tip: Apply the Policy Name filter to limit results to issues that violate specific policies.
|
| Portfolio ROI Dashboard | View the impact of Polaris on your portfolio's security profile over time. Includes charts that show open, detected, reintroduced, and absent issues in your portfolio over time. By default, results are limited to issues first detected in the last 12 months. You can extend or shorten this duration with the Issues First Detected in filter. |
| Remediation Dashboard | Shows the average time (in days) it takes to remediate issues (that is, from the time an issue is detected, the time it takes for the issue to be triaged and dismissed or no longer detected in tests) in your portfolio. Includes charts that show the 10 applications with the longest/shortest average remediation times in your portfolio, along with tables that show per-application, per-issue-type, and per-issue-severity remediation times. While the default (out-of-the-box) filters are active, the dashboard includes data from all the applications you have access to, and all issue severities. |
| Table - Component Search | View all the components used in your organization's applications and projects, along with the license each component is subject to. |
| Table - License Search | View all the licenses your organization's applications and projects are subject to, along with a description of each license, and each license's family. |
| Test Summary | Visualize the quantity of tests run against applications and projects in your organization.
Note: To include DAST test results, the Display Default Branch filter must be set to Include all (default) or true.
|
Save a dashboard (PDF, image)
-
Select the options
 button near the top of the page, Download, and select a format (Export to PDF or Download as Image).
Note: Saving a dashboard as an image is not supported in Firefox.
button near the top of the page, Download, and select a format (Export to PDF or Download as Image).
Note: Saving a dashboard as an image is not supported in Firefox.
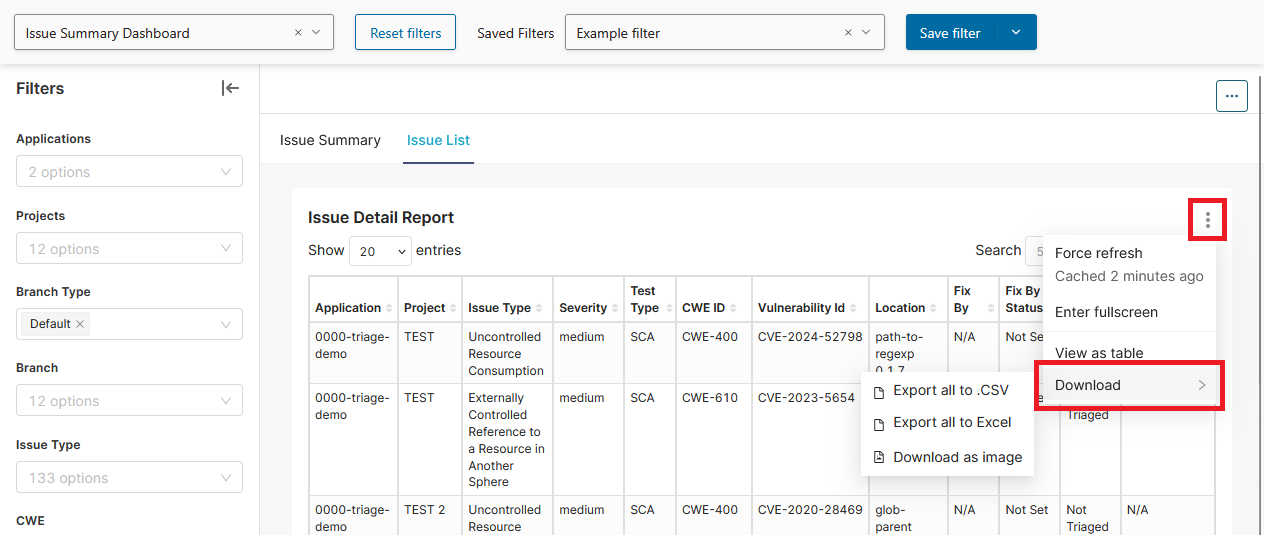
Export issue metadata (CSV, Excel, image)
-
Select Options
 > Download, and select a format (Export to .CSV, Export to Excel, Download as image).
Create and manage saved filters
Saved filters in Polaris are:
- User-specific: Filters are exclusive to the user who created them and cannot be shared with other users.
- Dashboard-specific: Each saved filter is associated exclusively with the dashboard for which it was created and cannot be transferred between dashboards.
Each user in your organization can create up to 25 saved filters per dashboard.
Create a saved filter
Follow these steps to create a saved filter:
Edit a saved filter
Follow these steps to edit a saved filter:
- Open a dashboard and select the saved filter you wish to modify using the Saved Filters dropdown menu.
- Use the options in the Filters panel to adjust the scope of the dashboard, as required.
- Select APPLY FILTERS, near the bottom of the Filters panel.
- Select .
Rename a saved filter
Follow these steps to change the name of a saved filter:
Reorder saved filters
Follow these steps to change the order of filters in the Saved Filters dropdown menu:
-
Drag and drop saved filters using the
 icon, as required.
Delete a saved filter
Follow these steps to delete a custom filter:
-
Select the delete
 icon next to the saved filter you wish to delete.