Get started: Contributor or Member

Before you begin, we recommend reading the following:

By the end of this process, you'll complete the following tasks.

  • Upload source files and start SAST and SCA tests
  • Monitor tests and view results
  • Filter and review issues
  • Triage issues
Note: Application contributors and application members have similar permissions in Polaris, but application members cannot create, update, or delete projects.

Upload files and start testing

Note: Before uploading, see the limitations for uploads on the Support page. There are guidelines for file type and size.
Follow these steps to upload and test source files for SAST & SCA project:
  1. Navigate to Portfolio.
  2. Select an application.
  3. Locate the SAST & SCA project you wish to test, click the ellipse icon in the project's row, and select New Test.


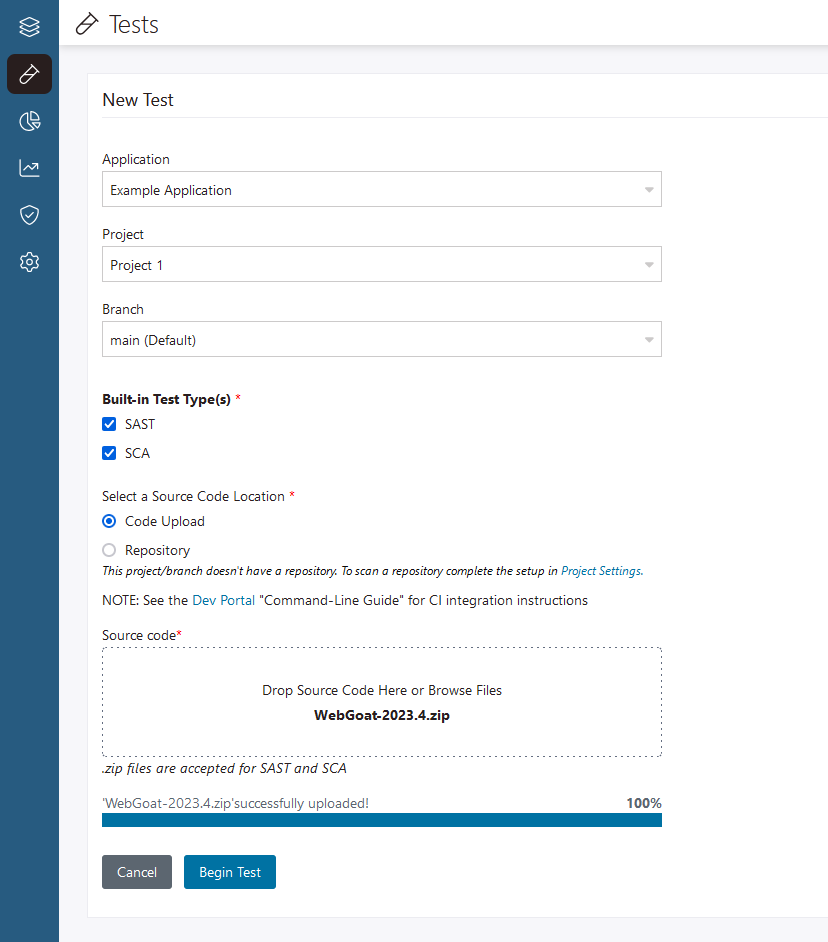
    The New Test page opens.

  4. (Optional) Select a branch to test.
  5. Use the SAST and SCA checkboxes to select test to run.
    Note: These options depend on what your Application Admin has made available for the project.
  6. Select Code Upload.
  7. Upload the files you want to test by dragging and dropping them into the browser window. Or click Browse Files and use the file chooser in your operating system to select files.


    Note: For Code Uploads, source code filenames can include letters, digits, and the characters “.”, “-” and “_”. No other characters or spaces are allowed.
  8. After the upload completes, click Begin Test.

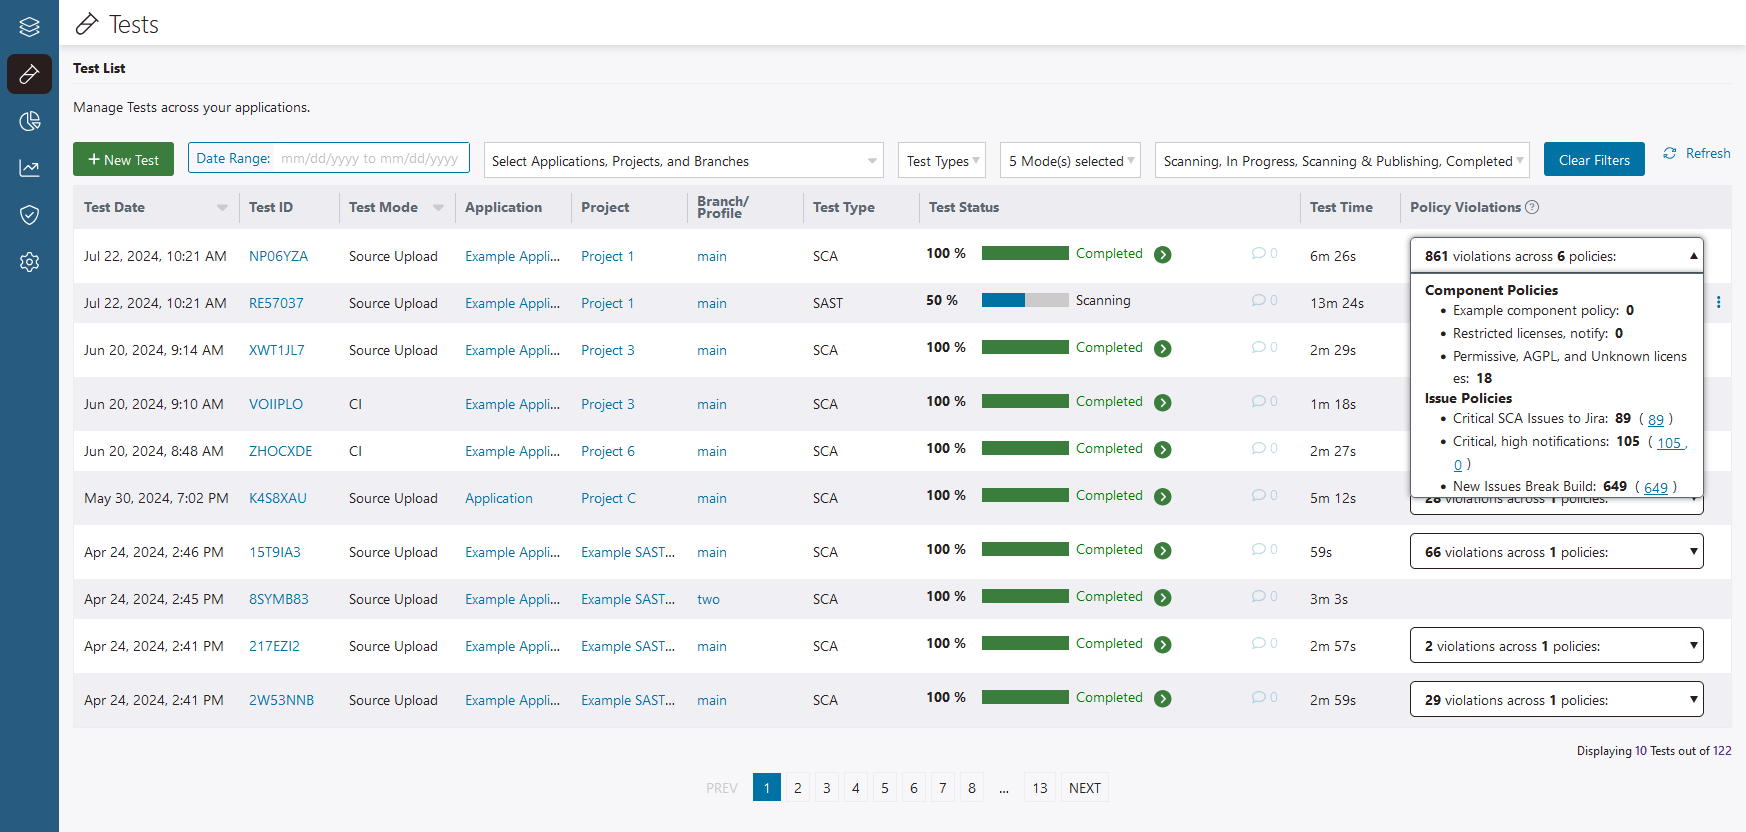
    You can monitor the progress of tests any time by navigating to Tests on the left-hand navbar. Test status is shown there, with the most recent tests listed first. Filter tests by date, type, mode, status, and the application, project, or branch tested.

    Note: If it is the first scan for your project, you might receive email communications from the Black Duck team that require a response in order for testing to finish.

Monitor tests and get test results

  1. Navigate to Tests in the left-hand navigation menu.


  2. If numerous tests are showing, you might need to filter to see your test. First try filtering on test status, for new tests.

    Depending on the size of your project, a test may take a number of hours to finish running. When the test is complete the progress bar shows 100 percent and a green circle enclosing an arrow appears to the right of the progress bar on the Tests page.


  3. To view test results, select the branch name in a completed test's row.

Filter and review the issues

You can get to the issues in either of the following ways:

  • Go to Portfolio, select an application, select a project, and open the Issues tab.
    Note: Use the branch pulldown (near the top of the page, next to the project name) to view test results for different branches in your project.
  • Go to Tests and select the branch name in a completed test's row.
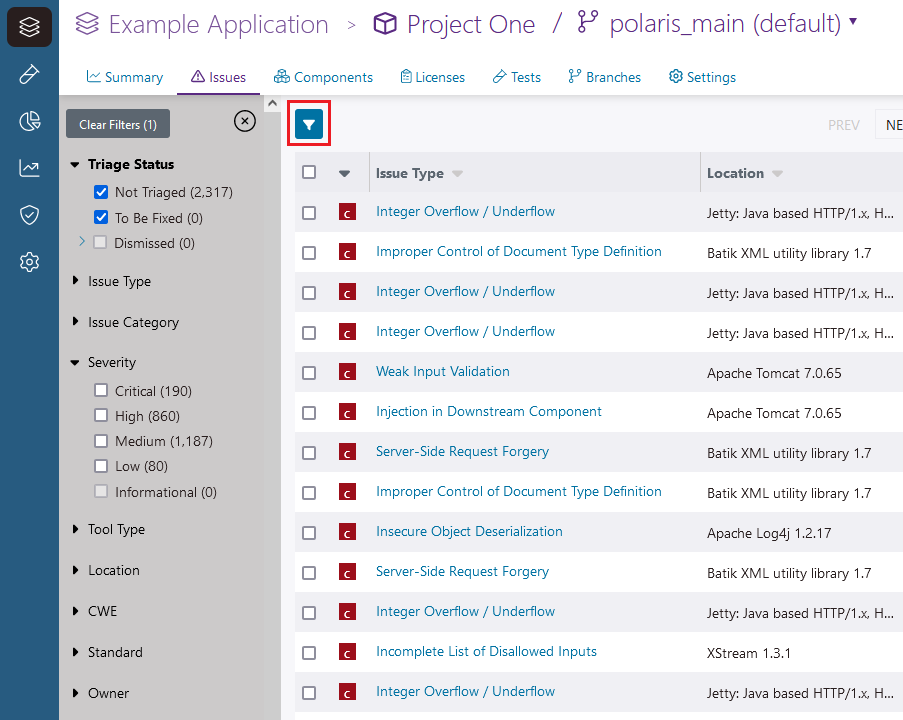
  1. Click the filter icon.

    The filters panel opens.


    Screenshot of filtering controls.
  2. Expand filter categories and use the checkboxes to apply filters.
    Try filtering the results according to issue type, severity, and triage status. (For example you might want to see issues that are not triaged, or all high severity issues that are not triaged.)
  3. After you apply a filter, select an issue in the list to open the Issue Details tab.

    Here, you can see:

    • A description of the issue and its local effects (that is, the risk it poses when present in your project)
    • A link to the Common Weakness Enumeration (CWE™) page, if available
    • A link to training resources in Secure Code Warrior, if available (and after the Secure Code Warrior integration is enabled by your Organization Administrator)
    • A link to the Common Vulnerabilities and Exposures (CVE®) page, if available
    • The Black Duck® Security Advisory (BDSA) code for the issue, if available
    • The name of the tool that discovered the issue
    • The time of the test that discovered the issue
    • A list of branches the issue is also detected in
    The Contributing Code Events tab appears when you select an issue captured by a SAST test. Here, you can see:
    • The location in your code where the issue is found
    • Detailed instructions to resolve the issue
      Note: After an Organization Administrator enables Polaris Assist, you can generate remediation guidance for SAST issues with AI. See Generate SAST remediation guidance with Polaris Assist (Beta) for more information.

    Use the issue view whenever you need to dig into an individual issue.